Overview
Unlike Pioneer Field 360, the “classic” version of Granular Insights field maps did not allow users to create or view vector based geospatial data, which limited the type of planning and analysis they could do. When Corteva decided to deprecate Pioneer Field 360, a beta version of a new type of map was introduced to Granular Insights. But this required users to navigate to 2 different sections within the tool, depending on the scenario. This created confusion over which map should be used for different scenarios. In addition to that, new mapping features meant to add value were not easily discoverable.
The challenge
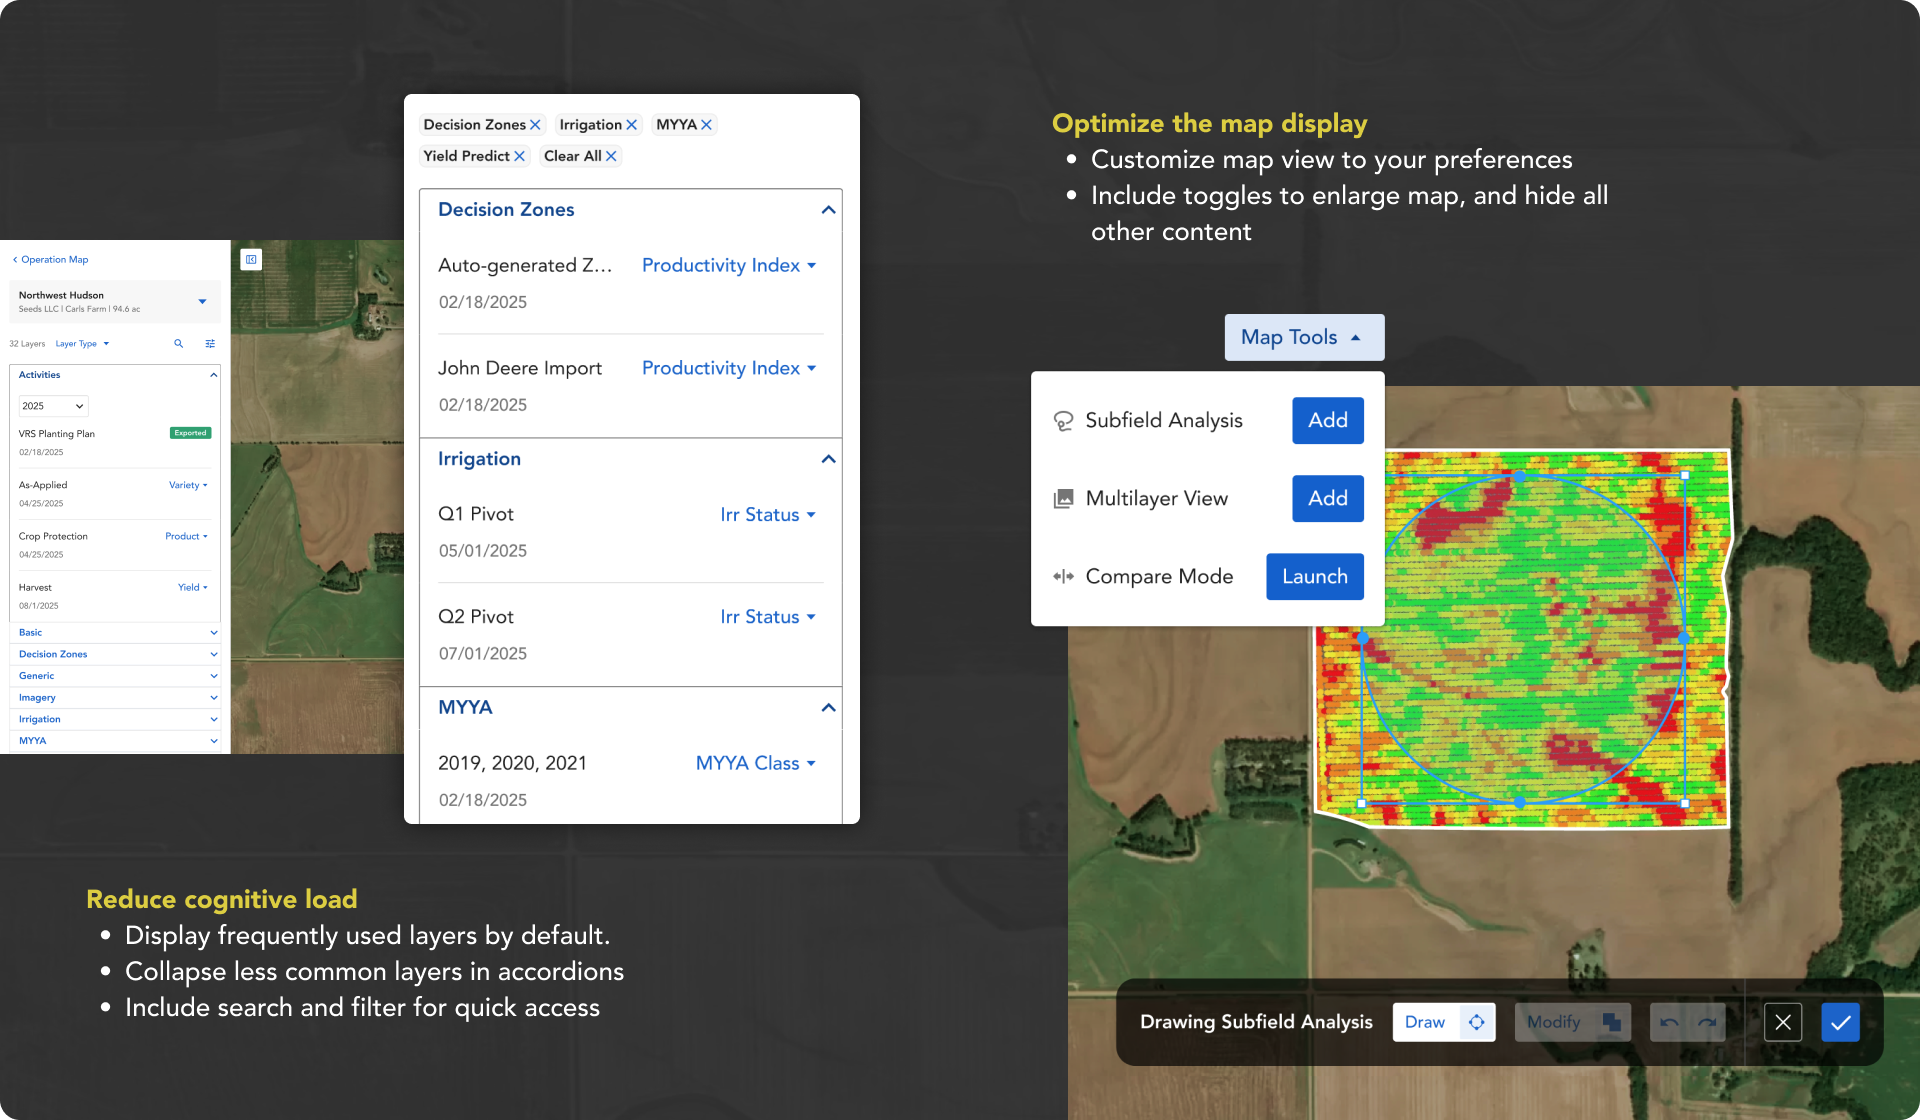
The experiences from “classic” maps and “map layers” needed to be united into one place. But combining the new features into the existing maps presented a few obstacles. The most significant was how much it would increase the list of layers for each field. We also needed to integrate the more complicated new features that cater towards power users without overwhelming Insight’s core audience, who only required the basic features.

The process
Discovery: A heuristic evaluation of the existing map was done to uncover existing flaws in the design that could be improved before additional enhancements were made. SME’s from Corteva and Seed Reps were consulted to understand the use cases behind the features we had been asked to integrate from Pioneer Field 360. And feedback from the beta release of Map Layers was collected to help refine the design.
Define Design Principles: Using the patterns that emerged from discovery, we were able to identify the core objectives. A few examples include; optimize the map display and reduce cognitive load. These principles served as guardrails to help guide the design decisions throughout the process. Design principles also help visualize what success would look like.
Build, Test, and Refine: A few tasks identified as key flows were designed and presented during internal stakeholders meetings. We also conducted testing to ensure users were able to navigate the experience as expected. Throughout the process, the design was refined using stakeholder and user feedback. Research tools such as Amplitude and Dovetail were used to analyze feedback, and review analytics to measure success.